temp_code_space
RTL & Logic Design
Live Run status is not available for this PC yet. Return to the editor to use its connected workspace.
Live Run
No runs in this sample project.
No matching files.
module CVO_top ( // The sub_emax bf16_add (align + 25-bit add + normalize) is the integrated worst // path; even after the 1a/1b split the align+add together were too long, so the // barrel-shift align and the 25-bit add are now separated by their own register // (sa0 holds the sign-extended aligned operands). Latency +1, bit-identical. bf16_t sa_av_wire, sa_bv_wire; logic [ 7:0] sa_emax_wire; logic [23:0] sa_aa_wire, sa_ba_wire; always_comb begin : comb_sub_emax_align sa_av_wire = to_bf16(in_data_s0); sa_bv_wire = to_bf16({~in_emax_s0[15], in_emax_s0[14:0]}); // -e_max sa_emax_wire = (sa_av_wire.exp > sa_bv_wire.exp) ? sa_av_wire.exp : sa_bv_wire.exp; sa_aa_wire = align_to_emax(sa_av_wire, sa_emax_wire); sa_ba_wire = align_to_emax(sa_bv_wire, sa_emax_wire); end // Stage sa0 — register the sign-extended aligned operands (align off the adder). logic signed [24:0] sa0_aa, sa0_ba; logic [ 7:0] sa0_emax; logic [15:0] sa0_pass; logic sa0_subemax; logic sa0_valid; always_ff @(posedge clk) begin if (!rst_n || i_clear) begin sa0_valid <= 1'b0; end else begin sa0_aa <= $signed({sa_aa_wire[23], sa_aa_wire}); sa0_ba <= $signed({sa_ba_wire[23], sa_ba_wire}); sa0_emax <= sa_emax_wire; sa0_pass <= in_data_s0; sa0_subemax <= uop_flags.sub_emax; sa0_valid <= in_valid_s0; end end // Stage 1a-back — the 25-bit signed add, now isolated on its own register stage. logic signed [24:0] sa_sum; logic [ 7:0] sa_emax; logic [15:0] sa_pass; // in_data_s0 carried for the non-sub_emax case logic sa_subemax; logic sa_valid; always_ff @(posedge clk) begin if (!rst_n || i_clear) begin sa_valid <= 1'b0; end else begin sa_sum <= sa0_aa + sa0_ba; sa_emax <= sa0_emax; sa_pass <= sa0_pass; sa_subemax <= sa0_subemax; sa_valid <= sa0_valid; end endaltifigence_npu_top · Full bundle B
This stored analysis run brings together 12 artifacts. The report links each observation to the source artifact.
| Waveform capture B | Signals 148 |
|---|---|
| Schematic snapshot B | Instances 42 |
| seed-full-analysis-run | Kernels 6 |
| Path analyzer B | Paths 31 |
| Memory dump B | Regions 6 |
| Event timeline B | Events 11.1k |
| Perf chart B | MAC avg 44.2% |
| Timing report B | WNS -0.07 ns |
| PPA snapshot B | Power 21.3 W |
| Evidence bundle B | Claims 14 |
| Data flow B | Nodes 36 |
| 3D canvas B | Grid 32 × 32 |
| Module | altifigence_npu_top |
|---|---|
| Source | rtl/altifigence-v002/LLM/rtl/top/altifigence_npu_top.sv |
| Run | altifigence-npu-full-v003 |
| Named view | Full bundle B |
| Artifacts | 12 |
The report reads the saved analysis bundle and reorganizes its metrics, detail rows, and notes into document sections.
Each artifact retains its own units and status. Compare neighboring metrics within the same artifact, then follow its source path to the stored evidence.
| Waveform | signal transitions and capture timing |
|---|---|
| Schematic | module connections and structural evidence |
| Roofline | compute throughput and arithmetic intensity |
| Path | critical paths and timing evidence |
| Memory | memory traffic and bandwidth |
| Events | recorded event activity |
| Perf | performance samples and utilization trends |
| Timing | timing margins |
| PPA | power, performance, and area estimates |
| Signoff | stored validation evidence |
| Data Flow | data movement between compute stages |
| 3D Canvas | stored spatial and placement evidence |
Flagged metrics from the stored artifacts.
| Waveform · MAC util | 47.5% |
|---|---|
| Waveform · Stalls | 518 |
| Schematic · Inline | 1 |
| Schematic · Diagnostics | 2 |
| Path · Worst slack | -0.07 ns |
| Path · Logic levels | 14 |
| Path · Fanout | 26 |
| Memory · Reads | 1.4 GB/s |
| Memory · Writes | 1.6 GB/s |
| Events · MAC | 36% |
| Events · Stalls | 18% |
| Perf · MAC avg | 44.2% |
| Perf · L2 write | 39.6% |
| Timing · WNS | -0.07 ns |
| Timing · TNS | -0.41 ns |
| Timing · Failing | 3 |
| PPA · Power | 21.3 W |
| PPA · LUT util | 67% |
| PPA · DSP util | 79% |
| PPA · Freq | 950 MHz |
| Signoff · Passed | 10 |
| Signoff · Open | 4 |
| Signoff · Coverage | 78% |
| Data Flow · Edges | 63 |
| Data Flow · Max depth | 11 |
| Data Flow · Hot path | HP→DISP→MAC |
| 3D Canvas · Avg util | 41.7% |
| 3D Canvas · Peak PE | 99% |
| 3D Canvas · Idle PEs | 173 |
| Waveform capture B | Signals 148 |
|---|---|
| Schematic snapshot B | Instances 42 |
| seed-full-analysis-run | Kernels 6 |
| Path analyzer B | Paths 31 |
| Memory dump B | Regions 6 |
| Event timeline B | Events 11.1k |
| Perf chart B | MAC avg 44.2% |
| Timing report B | WNS -0.07 ns |
| PPA snapshot B | Power 21.3 W |
| Evidence bundle B | Claims 14 |
| Data flow B | Nodes 36 |
| 3D canvas B | Grid 32 × 32 |
4981200 cycles · 32 cores · higher stall density
The Waveform section reviews signal transitions and capture timing. It reorganizes 4 metric(s), 2 detail row(s), and 0 note(s) from the “Waveform capture B” artifact into report form.
The first observation is MAC util = 47.5%. This value should be read against the neighboring metrics in the same artifact; the current flagged metric count is 2.
The Waveform section contains critical-level signals. Use the 2 flagged metric(s) to trace cause and scope.
This section summarizes 4 metric evidence item(s). The representative metric is MAC util = 47.5%, and source path is analyze/altifigence-npu-full-v003/waveform.json. The interpretation is linked to stored analysis output.
The “Waveform capture B” result in Waveform requires additional review. Compare MAC util = 47.5% against neighboring artifacts and inspect the detailed path in the full viewer.
AI opinion: Waveform requires careful interpretation. MAC util = 47.5% and 2 flagged metric(s) remain the main review points.
| Signals | 148 |
|---|---|
| Ticks | 4.98M |
| MAC util | 47.5% |
| Stalls | 518 |
| Top scope | u_gemm_systolic_top |
|---|---|
| Playhead | cycle 90210 |
analyze/altifigence-npu-full-v003/waveform.jsonSame hierarchy with fewer expanded inline blocks
The Schematic section reviews module connections and structural evidence. It reorganizes 4 metric(s), 0 detail row(s), and 0 note(s) from the “Schematic snapshot B” artifact into report form.
The first observation is Inline = 1. This value should be read against the neighboring metrics in the same artifact; the current flagged metric count is 2.
The Schematic section contains warning-level signals. Use the 2 flagged metric(s) to trace cause and scope.
This section summarizes 4 metric evidence item(s). The representative metric is Inline = 1, and source path is analyze/altifigence-npu-full-v003/schematic.json. The interpretation is linked to stored analysis output.
The “Schematic snapshot B” result in Schematic requires additional review. Compare Inline = 1 against neighboring artifacts and inspect the detailed path in the full viewer.
AI opinion: Schematic requires careful interpretation. Inline = 1 and 2 flagged metric(s) remain the main review points.
| Instances | 42 |
|---|---|
| Nets | 186 |
| Inline | 1 |
| Diagnostics | 2 |
analyze/altifigence-npu-full-v003/schematic.jsonFull bundle B · altifigence_npu_top
The Roofline section reviews compute throughput and arithmetic intensity. It reorganizes 4 metric(s), 0 detail row(s), and 0 note(s) from the “seed-full-analysis-run” artifact into report form.
The first observation is Kernels = 6. This value should be read against the neighboring metrics in the same artifact; the current flagged metric count is 0.
Read the Roofline metrics alongside the stored evidence and neighboring artifacts.
This section summarizes 4 metric evidence item(s). The representative metric is Kernels = 6, and source path is analyze/altifigence-npu-full-v003/roofline.json. The interpretation is linked to stored analysis output.
The source artifact preserves the values shown in this report.
AI opinion: compare Kernels = 6 with neighboring artifacts before drawing a conclusion.
| Kernels | 6 |
|---|---|
| Intensity | 11.8 |
| Achieved | 15.1 GOPS |
| Avg util | 41.7% |
analyze/altifigence-npu-full-v003/roofline.jsonWeight dispatcher queue path is tighter
The Path section reviews critical paths and timing evidence. It reorganizes 4 metric(s), 2 detail row(s), and 0 note(s) from the “Path analyzer B” artifact into report form.
The first observation is Worst slack = -0.07 ns. This value should be read against the neighboring metrics in the same artifact; the current flagged metric count is 3.
The Path section contains critical-level signals. Use the 3 flagged metric(s) to trace cause and scope.
This section summarizes 4 metric evidence item(s). The representative metric is Worst slack = -0.07 ns, and source path is analyze/altifigence-npu-full-v003/path-analyzer.json. The interpretation is linked to stored analysis output.
The “Path analyzer B” result in Path requires additional review. Compare Worst slack = -0.07 ns against neighboring artifacts and inspect the detailed path in the full viewer.
AI opinion: Path requires careful interpretation. Worst slack = -0.07 ns and 3 flagged metric(s) remain the main review points.
| Paths | 31 |
|---|---|
| Worst slack | -0.07 ns |
| Logic levels | 14 |
| Fanout | 26 |
| Start | GEMM_weight_dispatcher/clk |
|---|---|
| End | mem_u_operation_queue/push |
analyze/altifigence-npu-full-v003/path-analyzer.jsonHP buffer pressure elevated
The Memory section reviews memory traffic and bandwidth. It reorganizes 4 metric(s), 2 detail row(s), and 0 note(s) from the “Memory dump B” artifact into report form.
The first observation is Reads = 1.4 GB/s. This value should be read against the neighboring metrics in the same artifact; the current flagged metric count is 2.
The Memory section contains warning-level signals. Use the 2 flagged metric(s) to trace cause and scope.
This section summarizes 4 metric evidence item(s). The representative metric is Reads = 1.4 GB/s, and source path is analyze/altifigence-npu-full-v003/memory.json. The interpretation is linked to stored analysis output.
The “Memory dump B” result in Memory requires additional review. Compare Reads = 1.4 GB/s against neighboring artifacts and inspect the detailed path in the full viewer.
AI opinion: Memory requires careful interpretation. Reads = 1.4 GB/s and 2 flagged metric(s) remain the main review points.
| Regions | 6 |
|---|---|
| Reads | 1.4 GB/s |
| Writes | 1.6 GB/s |
| Watches | 3 |
| Hot region | HP Buffer FIFO |
|---|---|
| Cursor | 0x1000_0140 |
analyze/altifigence-npu-full-v003/memory.jsonMore systolic stalls in mid window
The Events section reviews recorded event activity. It reorganizes 4 metric(s), 2 detail row(s), and 0 note(s) from the “Event timeline B” artifact into report form.
The first observation is MAC = 36%. This value should be read against the neighboring metrics in the same artifact; the current flagged metric count is 2.
The Events section contains critical-level signals. Use the 2 flagged metric(s) to trace cause and scope.
This section summarizes 4 metric evidence item(s). The representative metric is MAC = 36%, and source path is analyze/altifigence-npu-full-v003/events.json. The interpretation is linked to stored analysis output.
The “Event timeline B” result in Events requires additional review. Compare MAC = 36% against neighboring artifacts and inspect the detailed path in the full viewer.
AI opinion: Events requires careful interpretation. MAC = 36% and 2 flagged metric(s) remain the main review points.
| Events | 11.1k |
|---|---|
| Cycles | 220 |
| MAC | 36% |
| Stalls | 18% |
| Peak lane | SYSTOLIC_STALL |
|---|---|
| Marker | cycle 142 |
analyze/altifigence-npu-full-v003/events.jsonLower MAC util with heavier DMA write share
The Perf section reviews performance samples and utilization trends. It reorganizes 4 metric(s), 0 detail row(s), and 0 note(s) from the “Perf chart B” artifact into report form.
The first observation is MAC avg = 44.2%. This value should be read against the neighboring metrics in the same artifact; the current flagged metric count is 2.
The Perf section contains warning-level signals. Use the 2 flagged metric(s) to trace cause and scope.
This section summarizes 4 metric evidence item(s). The representative metric is MAC avg = 44.2%, and source path is analyze/altifigence-npu-full-v003/perf.json. The interpretation is linked to stored analysis output.
The “Perf chart B” result in Perf requires additional review. Compare MAC avg = 44.2% against neighboring artifacts and inspect the detailed path in the full viewer.
AI opinion: Perf requires careful interpretation. MAC avg = 44.2% and 2 flagged metric(s) remain the main review points.
| MAC avg | 44.2% |
|---|---|
| L2 read | 35.8% |
| L2 write | 39.6% |
| Samples | 256 |
analyze/altifigence-npu-full-v003/perf.jsonPost-impl summary — one failing path cluster
The Timing section reviews timing margins. It reorganizes 4 metric(s), 2 detail row(s), and 0 note(s) from the “Timing report B” artifact into report form.
The first observation is WNS = -0.07 ns. This value should be read against the neighboring metrics in the same artifact; the current flagged metric count is 3.
The Timing section contains critical-level signals. Use the 3 flagged metric(s) to trace cause and scope.
This section summarizes 4 metric evidence item(s). The representative metric is WNS = -0.07 ns, and source path is analyze/altifigence-npu-full-v003/timing.json. The interpretation is linked to stored analysis output.
The “Timing report B” result in Timing requires additional review. Compare WNS = -0.07 ns against neighboring artifacts and inspect the detailed path in the full viewer.
AI opinion: Timing requires careful interpretation. WNS = -0.07 ns and 3 flagged metric(s) remain the main review points.
| WNS | -0.07 ns |
|---|---|
| TNS | -0.41 ns |
| Failing | 3 |
| Endpoints | 18.2k |
| LUT | 43,910 |
|---|---|
| DSP | 528 |
analyze/altifigence-npu-full-v003/timing.jsonHigher power for lower achieved throughput
The PPA section reviews power, performance, and area estimates. It reorganizes 4 metric(s), 0 detail row(s), and 0 note(s) from the “PPA snapshot B” artifact into report form.
The first observation is Power = 21.3 W. This value should be read against the neighboring metrics in the same artifact; the current flagged metric count is 4.
The PPA section contains critical-level signals. Use the 4 flagged metric(s) to trace cause and scope.
This section summarizes 4 metric evidence item(s). The representative metric is Power = 21.3 W, and source path is analyze/altifigence-npu-full-v003/ppa.json. The interpretation is linked to stored analysis output.
The “PPA snapshot B” result in PPA requires additional review. Compare Power = 21.3 W against neighboring artifacts and inspect the detailed path in the full viewer.
AI opinion: PPA requires careful interpretation. Power = 21.3 W and 4 flagged metric(s) remain the main review points.
| Power | 21.3 W |
|---|---|
| LUT util | 67% |
| DSP util | 79% |
| Freq | 950 MHz |
analyze/altifigence-npu-full-v003/ppa.jsonRegression vs bundle A on stall and timing claims
The Signoff section reviews stored validation evidence. It reorganizes 4 metric(s), 0 detail row(s), and 1 note(s) from the “Evidence bundle B” artifact into report form.
The first observation is Passed = 10. This value should be read against the neighboring metrics in the same artifact; the current flagged metric count is 3.
The Signoff section contains critical-level signals. Use the 3 flagged metric(s) to trace cause and scope.
This section summarizes 4 metric evidence item(s). The representative metric is Passed = 10, and source path is analyze/altifigence-npu-full-v003/evidence.json. The interpretation is linked to stored analysis output.
The “Evidence bundle B” result in Signoff requires additional review. Compare Passed = 10 against neighboring artifacts and inspect the detailed path in the full viewer.
AI opinion: Signoff requires careful interpretation. Passed = 10 and 3 flagged metric(s) remain the main review points.
| Claims | 14 |
|---|---|
| Passed | 10 |
| Open | 4 |
| Coverage | 78% |
Regression: timing closure and stall-rate claims diverged from bundle A.
analyze/altifigence-npu-full-v003/evidence.jsonHP buffer back-pressure adds a feedback edge into the dispatcher
The Data Flow section reviews data movement between compute stages. It reorganizes 4 metric(s), 3 detail row(s), and 1 note(s) from the “Data flow B” artifact into report form.
The first observation is Edges = 63. This value should be read against the neighboring metrics in the same artifact; the current flagged metric count is 3.
The Data Flow section contains critical-level signals. Use the 3 flagged metric(s) to trace cause and scope.
This section summarizes 4 metric evidence item(s). The representative metric is Edges = 63, and source path is analyze/altifigence-npu-full-v003/dataFlow.json. The interpretation is linked to stored analysis output.
The “Data flow B” result in Data Flow requires additional review. Compare Edges = 63 against neighboring artifacts and inspect the detailed path in the full viewer.
AI opinion: Data Flow requires careful interpretation. Edges = 63 and 3 flagged metric(s) remain the main review points.
| Nodes | 36 |
|---|---|
| Edges | 63 |
| Max depth | 11 |
| Hot path | HP→DISP→MAC |
| Source node | axi_hp_weight_dma |
|---|---|
| Sink node | result_packer |
| Feedback | hp_buffer_full → dispatcher |
Back-pressure feedback edge present in this run; raises the longest dependency chain to 11.
analyze/altifigence-npu-full-v003/dataFlow.jsonHot cluster in the south-east quadrant from DMA write stalls
The 3D Canvas section reviews stored spatial and placement evidence. It reorganizes 4 metric(s), 2 detail row(s), and 1 note(s) from the “3D canvas B” artifact into report form.
The first observation is Avg util = 41.7%. This value should be read against the neighboring metrics in the same artifact; the current flagged metric count is 3.
The 3D Canvas section contains critical-level signals. Use the 3 flagged metric(s) to trace cause and scope.
This section summarizes 4 metric evidence item(s). The representative metric is Avg util = 41.7%, and source path is analyze/altifigence-npu-full-v003/canvas3d.json. The interpretation is linked to stored analysis output.
The “3D canvas B” result in 3D Canvas requires additional review. Compare Avg util = 41.7% against neighboring artifacts and inspect the detailed path in the full viewer.
AI opinion: 3D Canvas requires careful interpretation. Avg util = 41.7% and 3 flagged metric(s) remain the main review points.
| Grid | 32 × 32 |
|---|---|
| Avg util | 41.7% |
| Peak PE | 99% |
| Idle PEs | 173 |
| Hottest tile | row 27 · col 29 |
|---|---|
| Cold band | cols 0–6 starved |
Utilisation skewed: a hot SE cluster coexists with a starved west band under heavier DMA writes.
analyze/altifigence-npu-full-v003/canvas3d.json| Waveform capture B | analyze/altifigence-npu-full-v003/waveform.json |
|---|---|
| Schematic snapshot B | analyze/altifigence-npu-full-v003/schematic.json |
| seed-full-analysis-run | analyze/altifigence-npu-full-v003/roofline.json |
| Path analyzer B | analyze/altifigence-npu-full-v003/path-analyzer.json |
| Memory dump B | analyze/altifigence-npu-full-v003/memory.json |
| Event timeline B | analyze/altifigence-npu-full-v003/events.json |
| Perf chart B | analyze/altifigence-npu-full-v003/perf.json |
| Timing report B | analyze/altifigence-npu-full-v003/timing.json |
| PPA snapshot B | analyze/altifigence-npu-full-v003/ppa.json |
| Evidence bundle B | analyze/altifigence-npu-full-v003/evidence.json |
| Data flow B | analyze/altifigence-npu-full-v003/dataFlow.json |
| 3D canvas B | analyze/altifigence-npu-full-v003/canvas3d.json |
The Perf artifact reports MAC avg = 44.2%, with two metrics flagged for review. Compare the heavier DMA write share against the Memory and Waveform artifacts.
The report is based on the stored sample bundle; the preview does not execute a new analysis.
| Waveform · MAC util | 47.5% |
|---|---|
| Waveform · Stalls | 518 |
| Schematic · Inline | 1 |
| Schematic · Diagnostics | 2 |
| Path · Worst slack | -0.07 ns |
| Path · Logic levels | 14 |
| Path · Fanout | 26 |
| Memory · Reads | 1.4 GB/s |
| Memory · Writes | 1.6 GB/s |
| Events · MAC | 36% |
| Events · Stalls | 18% |
| Perf · MAC avg | 44.2% |
| Perf · L2 write | 39.6% |
| Timing · WNS | -0.07 ns |
| Timing · TNS | -0.41 ns |
| Timing · Failing | 3 |
| PPA · Power | 21.3 W |
| PPA · LUT util | 67% |
| PPA · DSP util | 79% |
| PPA · Freq | 950 MHz |
| Signoff · Passed | 10 |
| Signoff · Open | 4 |
| Signoff · Coverage | 78% |
| Data Flow · Edges | 63 |
| Data Flow · Max depth | 11 |
| Data Flow · Hot path | HP→DISP→MAC |
| 3D Canvas · Avg util | 41.7% |
| 3D Canvas · Peak PE | 99% |
| 3D Canvas · Idle PEs | 173 |
Live Run status is not available for this PC yet. Return to the editor to use its connected workspace.
No runs in this sample project.
正在載入最新消息。
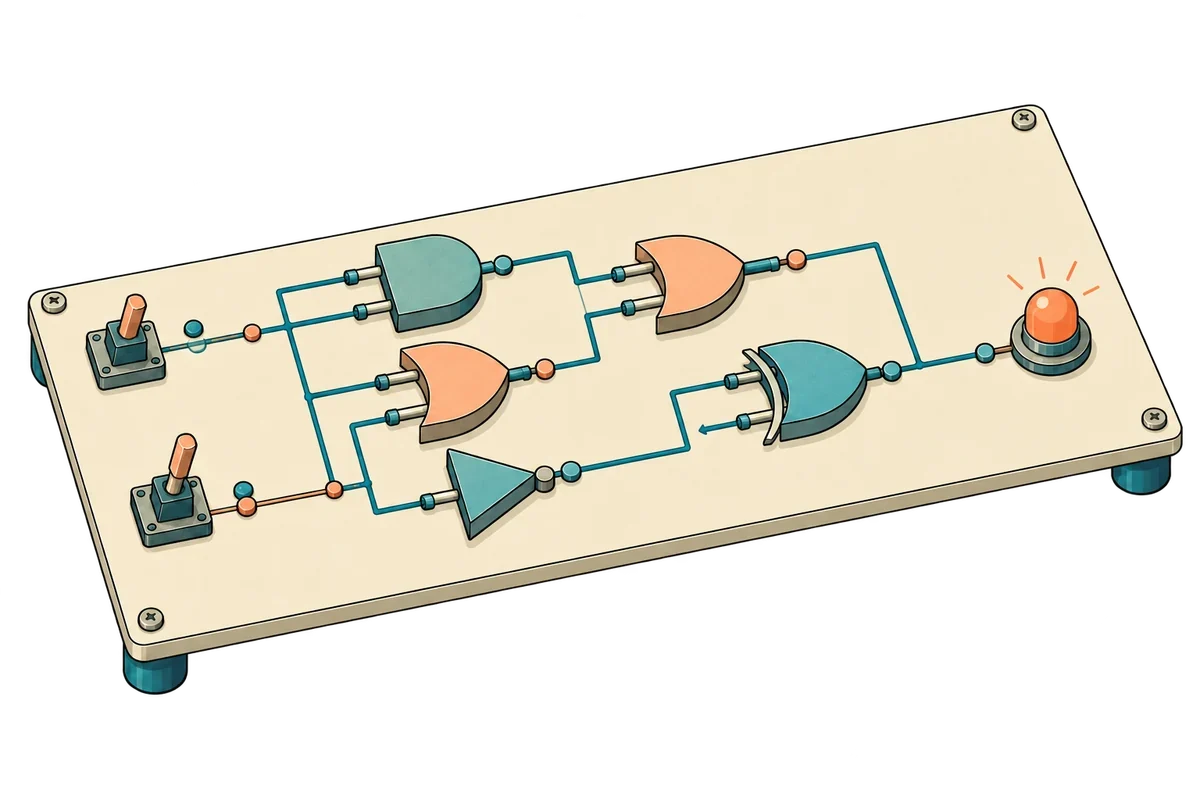
從數位訊號與 AND、OR、XOR 等邏輯閘出發,設計組合電路、鎖存器、正反器、計數器與狀態機。親自連結真值表、公式、電路與波形,再以 RTL 實作驗證。選修進階單元將延伸至資料路徑與介面。
查看課程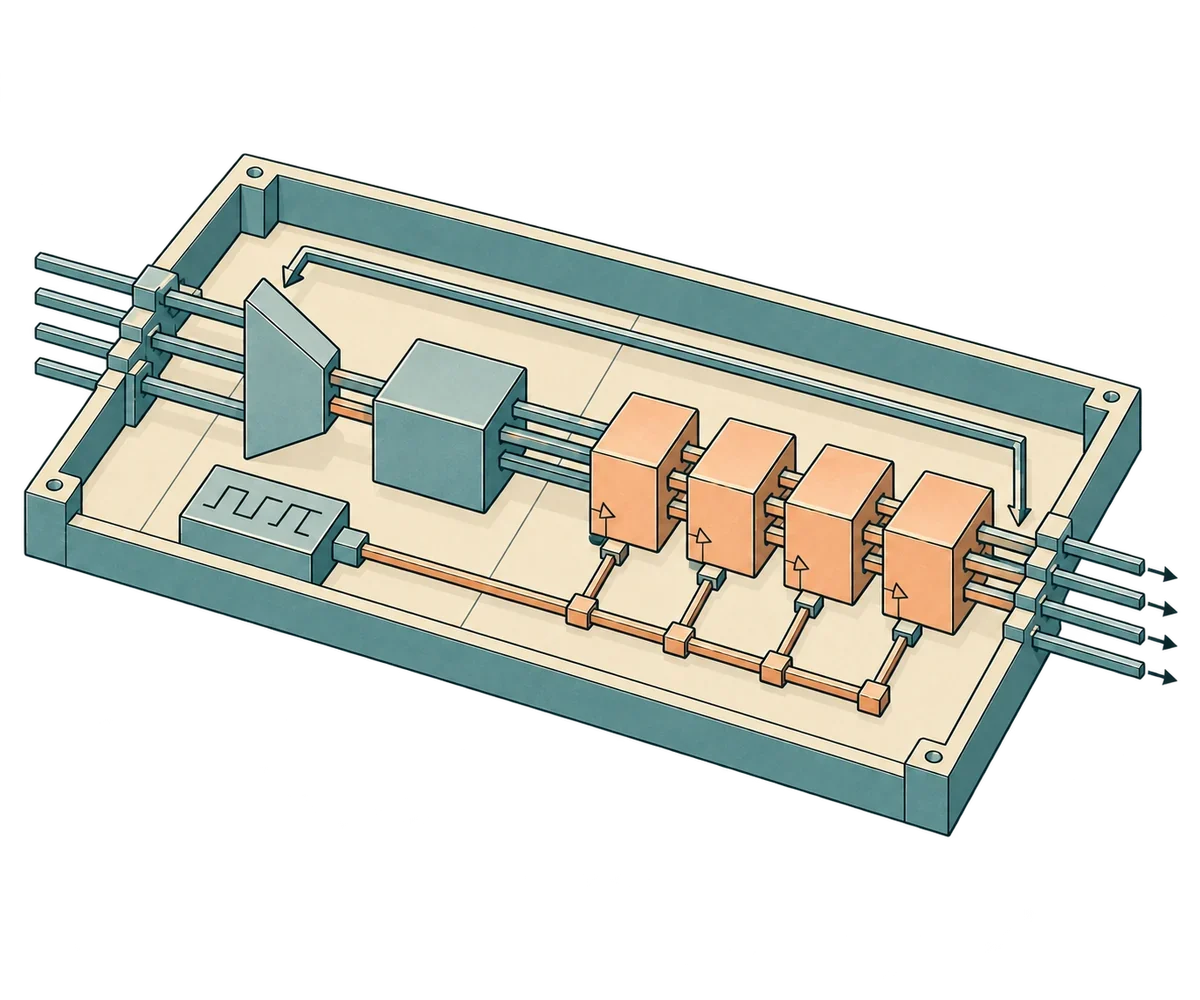
用 SystemVerilog 表達數位邏輯電路。學習型別、位元寬度、符號、組合與循序邏輯、模組、參數及 generate,再用獨立測試平台驗證邊界和失敗情況。最後連線週期脈衝與累加器,完成可重現的執行記錄。
查看課程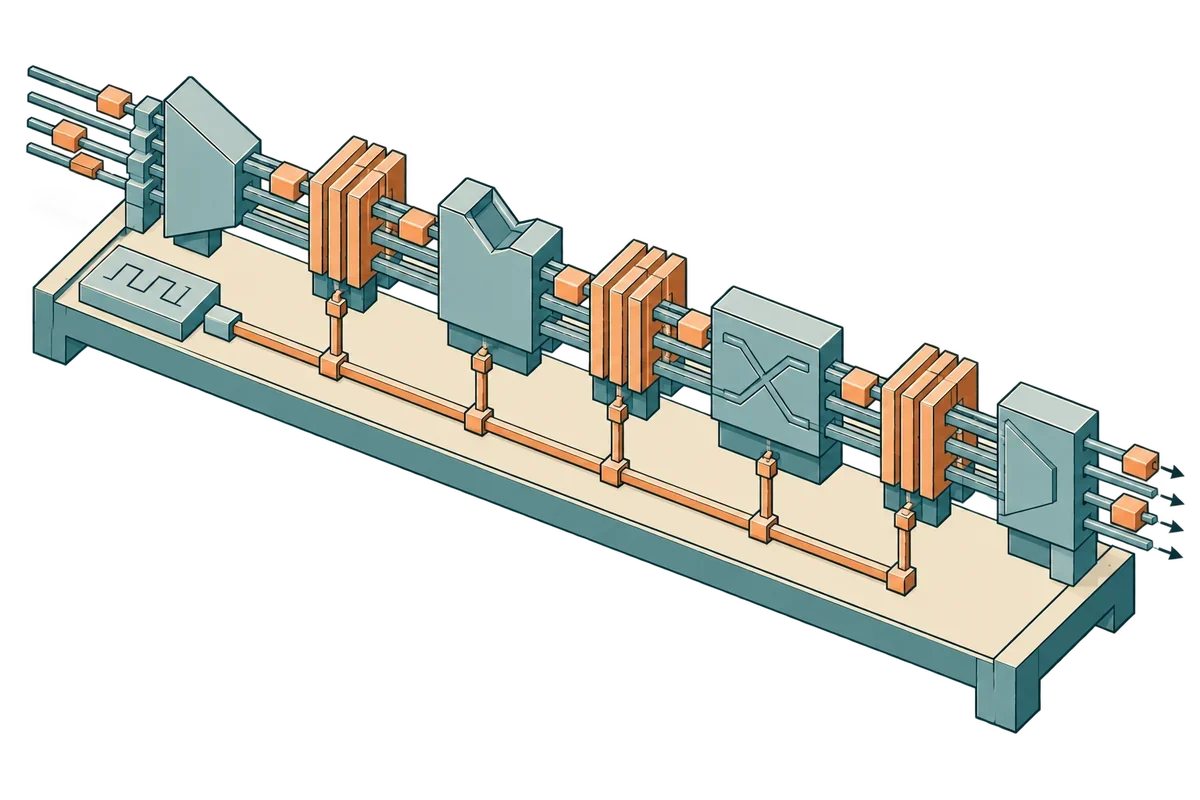
連接運算與控制,建立小型運算系統,再探索管線化執行。
查看課程